Understanding Trendlines and Support/Resistance Patterns in Technical Analysis
Many newcomers to technical analysis start with simple chart patterns. In this article, we'll introduce two commonly encountered formations—trendlines and support/resistance patterns—that traders often use to anticipate whether a trend will continue or reverse.
Definition: Trendlines
Trendlines are straight lines drawn on a price chart that connect significant highs or lows. They serve to illustrate the direction of price movement:
- In an uptrend, trendlines are drawn along ascending lows.
- In a downtrend, trendlines connect descending highs.
These lines help visualize market momentum and can also act as dynamic support or resistance levels.
Definition: Support and Resistance Patterns
Support and resistance levels are key price points where the forces of supply and demand balance:
- Support is a price level where buying pressure is strong enough to halt a decline, often causing a pause or reversal in a downtrend.
- Resistance is a price level where selling pressure overcomes buying pressure, limiting upward movement.
To sum up, Resistance and Support levels are price levels where, over a period of time, price movements most frequently exhibit pauses, reversals, or a slowing of momentum.
Role and Functions
Trendlines
Trendlines play several important roles:
- Identify Market Direction: They clarify whether the market is in an uptrend, downtrend, or moving sideways.
- Visualize Momentum: Connecting key price points highlights the strength and continuity of a trend.
- Signal Reversals: A break of a well-established trendline may indicate a shift in market sentiment, alerting traders to a potential trend reversal.
Support and Resistance Patterns
Support and resistance levels are equally vital:
- Highlight Key Price Zones: They pinpoint areas where the price is likely to stall or reverse.
- Guide Trading Decisions: Many traders use these levels to set stop-loss orders or target exit points.
- Confirm Trends: Consistent price reactions at these levels often validate the current trend's strength.
Practical Examples
Next, we'll illustrate these concepts with real-world examples using stock price data from early 2024 to early 2025. The following charts demonstrate how trendlines and support/resistance levels manifest in actual market conditions, providing a clearer picture of their practical application.
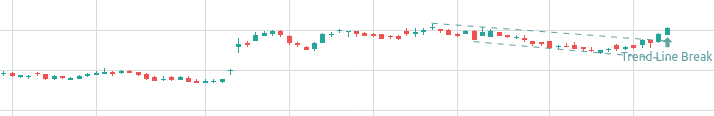
Example 1: Trendline in an Uptrend
In the chart below, an upward trendline connects successive higher lows, indicating an uptrend. This trendline not only shows the direction but can also act as a support level. A break below the trendline might signal a reversal.
Example 2: Support and Resistance in Action
The next chart illustrates distinct support and resistance levels. Notice how the price repeatedly bounces off a similar low (support) and faces rejection at a higher price (resistance). These levels help traders anticipate potential reversal points or breakouts.

At first glance, support and resistance levels might appear as precise price points where stocks consistently reverse direction. However, markets rarely move in a straight line, and price swings can be substantial. Relying solely on individual price points to define these levels often feels subjective and may not fully capture market volatility. To address this, we integrate the Average True Range (ATR) indicator into our analysis. This method transforms a single support or resistance level into a narrow band, and when combined with trading volume data, it helps us pinpoint the most likely support or resistance zone.
Conclusion
Trendlines and support/resistance patterns are fundamental tools in technical analysis. They offer a visual framework to interpret market trends, assess momentum, and identify key price levels. By mastering these techniques, traders can make more informed decisions, better manage risk, and enhance their overall trading strategy.
Understanding these concepts is crucial for anyone serious about navigating financial markets. The ability to accurately draw and interpret trendlines and support/resistance levels can significantly contribute to long-term trading success.
That said, it's important to keep in mind that technical analysis is not an exact science capable of predicting future price movements with absolute precision. These tools are just one part of a larger strategy. As you interpret trendlines, support/resistance levels, be sure to combine these insights with your own trading experience and a thorough understanding of market conditions and company fundamentals. This balanced approach will help you navigate the market more effectively.